Economic and corporate data support the initial strong reads on holiday retail sales despite the macro headwinds, reinforcing the idea that today’s consumer is in a better position than usual at this point in the business cycle. However, consumers were likely tapping into credit and using savings to support spending. In this week’s Weekly Market Commentary we share insights on publicly traded retailers, analyze their underperformance year to date, and look forward to 2023.
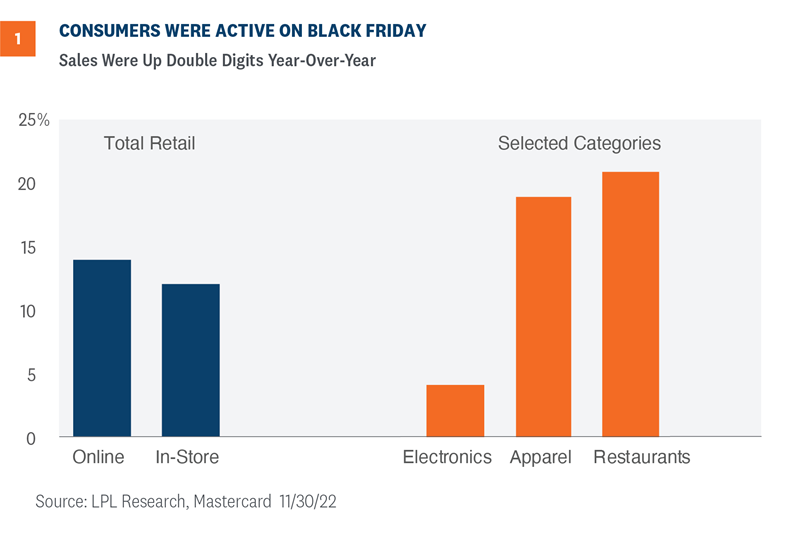
Consumer behavior during the Thanksgiving weekend is often a good predictor of overall holiday sales and the recent data point to growth this year. Consumers came out in droves on Black Friday, pushing nominal retail sales up over 10% from a year ago in both online and brick and mortar stores [Figure 1]. Elevated inflation this past year appeared to marginally impact the consumer but despite high prices, consumers were active on the Friday after Thanksgiving. Consumers were especially interested in heading to restaurants after Thanksgiving Day – spending at restaurants was over 20% above last Black Friday, partially driven by higher food prices but also supported by a resilient consumer.

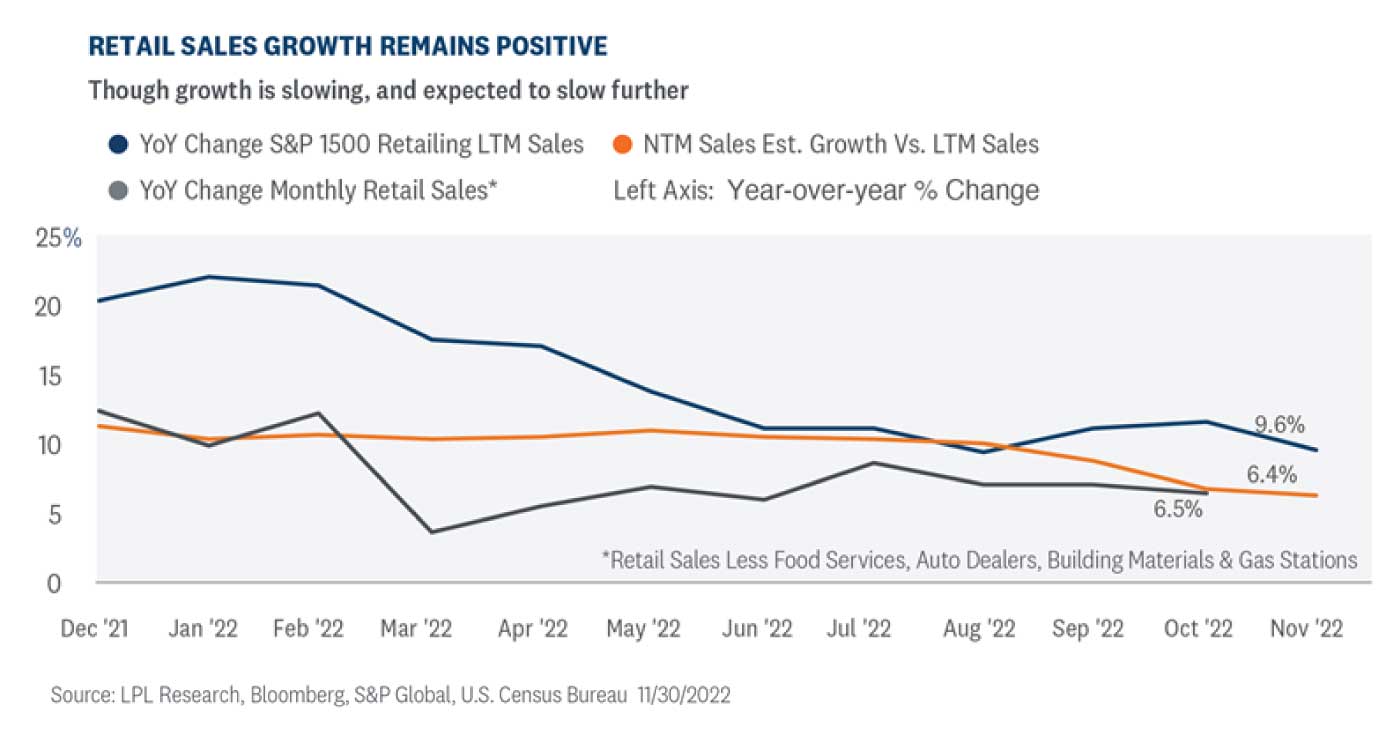
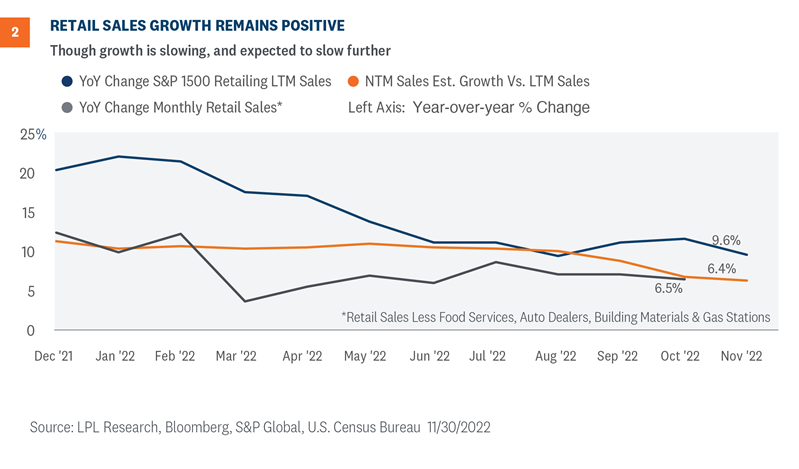
Economic and corporate data support the initial strong reads on holiday retail sales despite the macro headwinds, reinforcing the idea that today’s consumer is in a better position than usual at this point in the business cycle. Retail sales data from the Census Bureau (we focus on the Retail Sales excluding Food Service, Autos, Building Materials, and Gas Stations statistics) has shown year-over-year growth, slow from the average mid-teens numbers seen in 2021, to a still healthy upper-single digits number in 2022 [Figure 2]. The most recent read from October 2022 came in at 6.5%, above the long-term trend.
Reported sales from public retailers tell a similar story, and we see this data generally tracks the Census Bureau’s measure over time. We analyzed the S&P 1500 retailing industry group index, a cap weighted index of roughly 70 publicly traded U.S. retailers that is a slice of the broader consumer discretionary sector, and includes large, mid, and small cap companies. The year-over-year growth of trailing 12 month sales per share has slowed to 9.6%, down from the 20% pandemic rebound growth figures in 2021 and into 2022, but still slightly above the long-term trend of 8.5% over the last 20 years, pre-2020.
Forward-looking sales estimates paint a more subdued picture, which makes sense given the macro headwinds facing the economy and the consumer. However, the estimate for S&P 1500 retailing index’s next 12 months sales per share does imply 6.4% growth compared with the current reported last 12 months sales per share, and given the expectations for goods inflation this is not simply reflecting higher costs. Simply put, analysts are forecasting a slowdown in retail sales, but forecasts do not imply negative real growth.

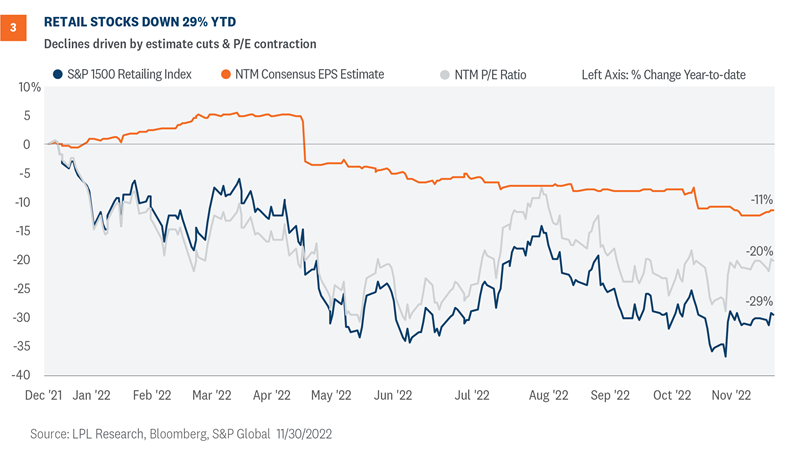
If the consumer has remained resilient, as evidenced by economic data and corporate sales, public retailer equities have been anything but. The retailers are down 29% to date, compared to the broad S&P 1500 and S&P 500—both down 14% year to date. Retailing is typically a competitive, lower margin business, and stocks typically trade on earnings expectations. Rolling forward (next 12 months) EPS estimates for the industry group have declined about 11% from the start of the year [Figure 3], and current year quarterly earnings have been a mixed bag of positive surprises and newsworthy stumbles. “Big Box” stores (aka multiline retail) have seen some of the larger earnings misses, as changing consumer behaviors coming out of the pandemic left stores with bloated inventories of pandemic favorites such as exercise bikes and patio furniture.

Looking forward and beyond inventory clearing discounts, input costs are also pressuring retail margins and earnings, namely labor costs. Retail wages, as measured by the Employment Cost Index from the Bureau of Labor Statistics, were up 7.2% year over year in the third quarter of 2022. This is down slightly from 7.6% in Q2 2022, but still among the highest reads across the entire labor market. Add in the increased cost of merchandise and goods, and the decline in EPS estimates is not surprising, as there is only so much retailers can pass on to consumers in the form of higher prices.
Retailer valuations have also taken a hit, as the forward (next 12 months) P/E multiple has contracted ~20% year to date, from ~27x to ~22x currently. Multiples typically expand and contract through the business cycle, and at a company specific level, growth and returns are generally the metrics to analyze. We have covered both: slowing growth and declining returns (measured by falling earnings). Decomposing the year to date returns, we roughly get to the 29% decline by multiplying falling earnings estimates by the contracted earnings multiple.
Low unemployment and rising wages support consumer spending during this holiday season. Despite historically high inflation rates and an aggressive Federal Reserve, consumer demand is holding up in 2022. Risks are rising for 2023 as consumers are likely tapping credit and personal savings to keep up spending habits.
Despite consumer spending and retail sales holding up relatively well in 2022, publicly traded retailers’ stocks have looked forward and underperformed. Retail stocks, measured via the retailing industry group, have declined more than most industry groups in both the S&P 1500 and S&P 500, delivering the fifth worst performance among 24 industry groups.
Inflationary pressures and changing consumer habits have eaten into profits and forward profit expectations, while the slowing growth outlook has re-rated market multiples downward.
Going forward, we are cautious on the broader consumer discretionary sector, where the retailing industry group resides. The expected slowdown in 2023, even a mild slowdown, will ultimately lead to a pullback in discretionary spending and sales at retailers. Large publicly traded retailers will not be immune from this pullback, though they may have levers to pull to subdue margin degradation. However, even if current earnings expectations for next year are correct, we see limited upside near term. The LPL Research Strategic & Tactical Asset Allocation Committee (STAAC) continues to hold a cautious view and an underweight to the S&P 500 consumer discretionary sector, from an asset allocation perspective.
Faster than expected deceleration in inflation and the economy avoiding a recession altogether (i.e., a “soft landing”) could lead to a more constructive environment for retailing equities.
Jeffrey Roach, PhD, Chief Economist, LPL Financial
Thomas Shipp, CFA, Quantitative Equity Analyst, LPL Financial
IMPORTANT DISCLOSURES
This material is for general information only and is not intended to provide specific advice or recommendations for any individual. There is no assurance that the views or strategies discussed are suitable for all investors or will yield positive outcomes. Investing involves risks including possible loss of principal. Any economic forecasts set forth may not develop as predicted and are subject to change.
References to markets, asset classes, and sectors are generally regarding the corresponding market index. Indexes are unmanaged statistical composites and cannot be invested into directly. Index performance is not indicative of the performance of any investment and do not reflect fees, expenses, or sales charges. All performance referenced is historical and is no guarantee of future results.
Any company names noted herein are for educational purposes only and not an indication of trading intent or a solicitation of their products or services. LPL Financial doesn’t provide research on individual equities.
All information is believed to be from reliable sources; however, LPL Financial makes no representation as to its completeness or accuracy.
US Treasuries may be considered “safe haven” investments but do carry some degree of risk including interest rate, credit, and market risk. Bonds are subject to market and interest rate risk if sold prior to maturity. Bond values will decline as interest rates rise and bonds are subject to availability and change in price.
The Standard & Poor’s 500 Index (S&P500) is a capitalization-weighted index of 500 stocks designed to measure performance of the broad domestic economy through changes in the aggregate market value of 500 stocks representing all major industries.
The PE ratio (price-to-earnings ratio) is a measure of the price paid for a share relative to the annual net income or profit earned by the firm per share. It is a financial ratio used for valuation: a higher PE ratio means that investors are paying more for each unit of net income, so the stock is more expensive compared to one with lower PE ratio.
Earnings per share (EPS) is the portion of a company’s profit allocated to each outstanding share of common stock. EPS serves as an indicator of a company’s profitability. Earnings per share is generally considered to be the single most important variable in determining a share’s price. It is also a major component used to calculate the price-to-earnings valuation ratio.
All index data from Bloomberg.
For a list of descriptions of the indexes and economic terms referenced in this publication, please visit our website at lplresearch.com/definitions.
This research material has been prepared by LPL Financial LLC.
Securities and advisory services offered through LPL Financial (LPL), a registered inv estment advisor and broker -dealer (member FINRA/SIPC). Insurance products are offered through LPL or its licensed affiliates. To the extent you are receiving investment a dvice from a separately registered independent investment advisor that is not an LPL affiliate, please note LPL makes no representation with respect to such entity.
| Not Insured by FDIC/NCUA or Any Other Government Agency | Not Bank/Credit Union Guaranteed | Not Bank/Credit Union Deposits or Obligations | May Lose Value |
RES-1350550-1222 | For Public Use | Tracking # 1-05349896 (Exp. 12/2023)
Many people are curious to understand the potential tax benefits available to them. Questions such as “Is a 529 plan right for me and my goals?” are common, and at Capital Planning, we’ll be happy to guide you on this and any other questions you have.
We can work with you to conduct an analysis of funding needs, and provide recommendations as to investment allocation, ultimately helping you to select the right investments for your goals.
Book a discovery meeting today and speak with one of our advisors about independent financial planning with purpose, so you can focus on enjoying life.