After a difficult September for stocks, investors are surely ready to flip the calendar to October. That’s the month that kicks off the historically strong fourth quarter. Expecting this pattern to repeat this year is tricky given the overhang of a government shutdown, interest rates near 16-year highs, a market still trying to digest the Federal Reserve’s “higher for longer” message, and a consumer who is facing some stiff headwinds as excess savings are drawn down, student loan payments restart, and the effects of higher borrowing costs are increasingly felt. Amid that complicated backdrop, here we assess prospects for a fourth-quarter rally.
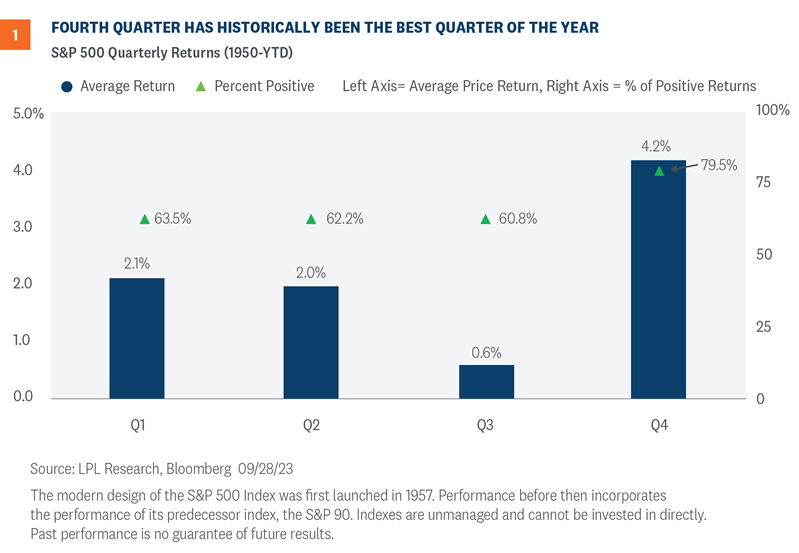
The fourth quarter has historically been the best for stocks, and it hasn’t been a particularly close race. As you can see in Figure 1, the S&P 500 has posted an average gain during the quarter of 4.2%, widely outpacing the underwhelming 0.6% average gain in the third quarter. Furthermore, the index has finished higher nearly 80% of the time in the fourth quarter. While we can’t say with certainty why the quarter’s performance historically sticks out, it does usually overlap with updated full-year company guidance for the following year, portfolio window dressing into year-end, overall holiday season optimism, and of course a good starting point due to weak September seasonality. Looking ahead, with the S&P 500 up 11.7% year to date as of September 29 (quarter end, by the way), another 4.2% on top of that would make for a pretty good year.
The month of October hasn’t historically been one of the best months, ranking sixth over the past five years, third and fourth over the past 10 and 20 years, and seventh since 1950. Not too exciting.
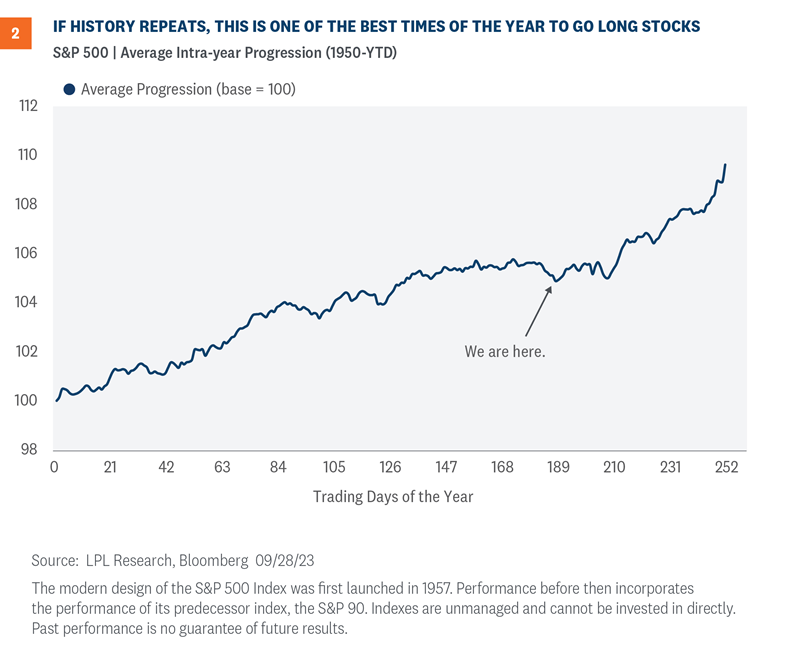
But if you peel back the onion and look at the average path of the S&P 500 over a calendar year, as we have done in Figure 2, you will see stocks tend to bottom in October. That means those strong fourth-quarter rallies don’t typically start until we’re a couple of weeks or so into the quarter. It also means the best two-month period of the year for the S&P 500, on average, is November and December, which we wrote about here last week.
Expectations for volatility also tend to come down as we move into October. The CBOE Volatility Index, more commonly referred to as the VIX or ‘fear gauge,’ jumped as much as 40% last month as investors bid up the cost of hedging downside risk. While the move higher was significant, it is not surprising given volatility is mean reverting, and the VIX came into September at a three-year low. In addition, the VIX historically advances in September before finally peaking on the year near the end of September/early October—around the 40th week of the year, which happens to be this week.
This market may be set up for that fourth-quarter rally we often see, but several things have to happen for the markets to deliver. Perhaps the most obvious potential catalyst for a fourth-quarter rally is lower interest rates.
From a fundamental perspective, rates have been driven higher by a U.S. economy that has continued to outperform expectations, pushing recession expectations out further, and by the unwinding of rate cut expectations by the Federal Reserve (Fed) to be more in line with the Fed’s “higher for longer” regime. These dynamics have led to a dis-inversion of the yield curve, with the 10-year yield rising faster than the 2-year (called a bear steepener).
Perhaps surprising to some, given inflation expectations remain relatively well anchored, the move higher in yields recently has been more about improving economic growth and fixed income investors essentially demanding additional compensation for owning longer maturity Treasuries (referred to by bond wonks as the bond term premia). It has not been about rising inflation expectations.
So, where do we go from here, after this relentless move higher of 0.8% in only three months? A lot of the aforementioned catalysts have played out, in our view, but until the economic data softens, which we expect over the next several months, we’re unlikely to see meaningfully lower yields. A re-acceleration in inflation or central banks globally selling more Treasuries, where the supply/demand picture is tenuous, could push rates higher.
As such, from a fundamental perspective, we’re likely going to see yields in the 4.25% to 4.75% range throughout the rest of 2023, along with the potential to see further flattening of the yield curve, and thus yields, across the curve at or above 5%.
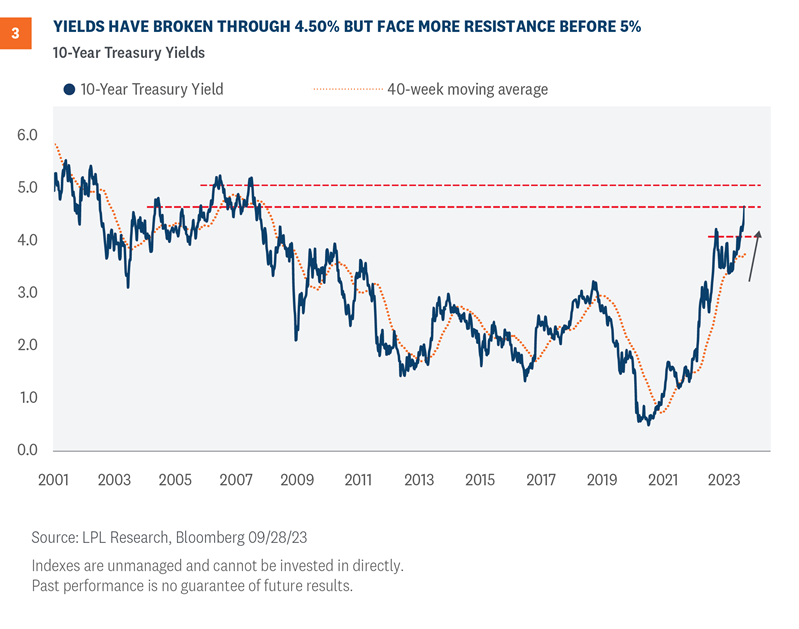
The fundamental call for the 10-year Treasury yield to perhaps remain in the 4s through year-end matches up well with the technical analysis picture. As shown in Figure 3, 10-year yields have broken out above the October 2022 highs at 4.34%, leaving 4.70% and 4.90% as the next areas of overhead resistance. Momentum is confirming the breakout, but yields are now historically overbought. The Relative Strength Index (RSI)—a momentum oscillator used to measure the speed and magnitude of price action—climbed to 73 last week, marking its highest reading in nearly a year.
Traders are also positioned for higher yields as short positions in 10-year Treasuries remain near record highs. The most recent Commodity Futures Trading Commission (CFTC) data shows total short positions among leveraged funds (typically hedge funds or speculators) reached 1.7 million contracts last month, coming in just below the record-high of 1.8 million contracts in May. It is important to note that extremes in futures positioning are often found at major inflection points and are commonly used as a contrarian indicator. Given the degree of overbought conditions, and the potential for some short covering, yields appear vulnerable to a short-term pullback and/or consolidation phase; however, the longer-term trend for now is up.
Over the weekend, House Speaker Kevin McCarthy struck a surprising last-minute deal with House Democrats to avert a government shutdown and extend current government funding levels for six weeks. The news initially sent stocks higher in pre-market trading before gains faded Monday morning. But before you get too comfortable, keep in mind in six weeks we may be right back in the same situation we were in last week. (For more background on government shutdowns, we wrote about it here last week.)
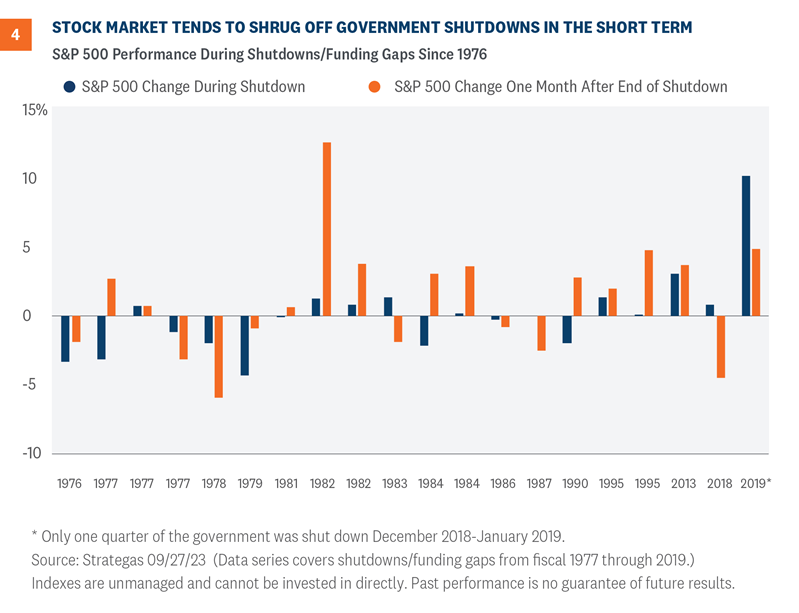
With that possibility in mind, as negotiations ramp back up again over the next several weeks, the key question for investors will be what impact a shutdown could have on the markets and economy. Well, the history of stock market performance during and shortly after shutdowns is encouraging, as shown Figure 4. On average, stocks have been flat during the past 20 shutdowns, but have been higher during the last five, as markets view these events as temporary with very little economic impact. Also consider that stocks have been higher by an average of 1.1% during the one month after previous shutdowns ended, with gains in 60% of those periods.
In terms of a potential economic impact, longer shutdowns can be meaningful drags, potentially detracting as much as 0.2% from gross domestic product (GDP) by some estimates (and they obviously impact those whose paychecks are delayed). Long shutdowns can even delay the release of government economic data, which could become an issue for the Fed’s data dependent monetary policy decisions if the government shuts down in November.
While falling rates are the most obvious potential catalyst for stocks to rally through year-end, third quarter earnings season starts in a couple of weeks and carries the potential to buoy investor sentiment. For one, third quarter results may bring an end to the earnings recession. Second, results excluding energy sector earnings declines have been excellent relative to expectations in the last few quarters. Third, economic growth based on third quarter data has continued to exceed expectations, pointing to potential GDP growth north of 3%. And finally, though energy sector profits will be down, recent strength may leave analysts’ estimates overly conservative. Pushing in the other direction and something that may cap earnings upside for multinationals is a strong U.S. dollar, up about 3% vs. a broad basket of currencies since June 30. Watch for more on earnings season here over the next few weeks.
The market may be set up well for a fourth quarter rally. However, based on seasonal trends, it may have to wait until the back half of October. Whether that late-year rally comes will depend in large part on where interest rates go. It may be difficult for corporate America to come up with enough good things to say to drive stocks higher given the economy is starting to lose some momentum and the dollar is so strong. And although the government shutdown has been averted for now, it still carries the potential to disrupt investor confidence and put pressure on Treasuries next month.
Broadly, the Strategic and Tactical Asset Allocation Committee (STAAC) recommends a neutral tactical allocation to equities, with a modest overweight to fixed income funded from cash. The risk-reward trade-off between stocks and bonds looks relatively balanced to us, with core bonds providing a yield advantage over cash.
Within equities, the STAAC recommends being neutral on style, favors large caps over small, and suggests overweight allocations to the energy and industrials sectors, where appropriate. The STAAC still slightly favors developed international equities over the U.S. on the upbeat outlook in Japan, while maintaining an underweight recommendation for emerging markets (EM).
Within fixed income, the STAAC recommends an up-in-quality approach with benchmark-level interest rate sensitivity. Core bond sectors (U.S. Treasuries, agency mortgage-backed securities (MBS), and short-maturity investment grade corporates) currently look more attractive than plus sectors (high-yield bonds and non-U.S. sectors), with the exception of preferred securities, which look attractive after having sold off due to stresses in the banking system.
Jeffrey Buchbinder, CFA, Chief Equity Strategist
Lawrence Gillum, CFA, Chief Fixed Income Strategist
Adam Turnquist, CMT, Chief Technical Strategist
IMPORTANT DISCLOSURES
This material is for general information only and is not intended to provide specific advice or recommendations for any individual. There is no assurance that the views or strategies discussed are suitable for all investors or will yield positive outcomes. Investing involves risks including possible loss of principal. Any economic forecasts set forth may not develop as predicted and are subject to change.
References to markets, asset classes, and sectors are generally regarding the corresponding market index. Indexes are unmanaged statistical composites and cannot be invested into directly. Index performance is not indicative of the performance of any investment and do not reflect fees, expenses, or sales charges. All performance referenced is historical and is no guarantee of future results.
Any company names noted herein are for educational purposes only and not an indication of trading intent or a solicitation of their products or services. LPL Financial doesn’t provide research on individual equities.
All information is believed to be from reliable sources; however, LPL Financial makes no representation as to its completeness or accuracy.
US Treasuries may be considered “safe haven” investments but do carry some degree of risk including interest rate, credit, and market risk. Bonds are subject to market and interest rate risk if sold prior to maturity. Bond values will decline as interest rates rise and bonds are subject to availability and change in price.
Preferred stock dividends are paid at the discretion of the issuing company. Preferred stocks are subject to interest rate and credit risk. As interest rates rise, the price of the preferred falls (and vice versa). They may be subject to a call feature with changing interest rates or credit ratings.
Mortgage-backed securities are subject to credit, default, prepayment, extension, market and interest rate risk.
Bonds are subject to market and interest rate risk if sold prior to maturity. Bond values will decline as interest rates rise and bonds are subject to availability and change in price.
The Standard & Poor’s 500 Index (S&P500) is a capitalization-weighted index of 500 stocks designed to measure performance of the broad domestic economy through changes in the aggregate market value of 500 stocks representing all major industries.
The PE ratio (price-to-earnings ratio) is a measure of the price paid for a share relative to the annual net income or profit earned by the firm per share. It is a financial ratio used for valuation: a higher PE ratio means that investors are paying more for each unit of net income, so the stock is more expensive compared to one with lower PE ratio.
Earnings per share (EPS) is the portion of a company’s profit allocated to each outstanding share of common stock. EPS serves as an indicator of a company’s profitability. Earnings per share is generally considered to be the single most important variable in determining a share’s price. It is also a major component used to calculate the price-to-earnings valuation ratio.
All index data from FactSet.
Value investments can perform differently from the market as a whole. They can remain undervalued by the market for long periods of time.
The prices of small cap stocks are generally more volatile than large cap stocks.
International investing involves special risks such as currency fluctuation and political instability and may not be suitable for all investors. These risks are often heightened for investments in emerging markets.
LPL Financial does not provide investment banking services and does not engage in initial public offerings or merger and acquisition activities.
For a list of descriptions of the indexes and economic terms referenced in this publication, please visit our website at lplresearch.com/definitions.
This research material has been prepared by LPL Financial LLC.
Securities and advisory services offered through LPL Financial (LPL), a registered inv estment advisor and broker -dealer (member FINRA/SIPC). Insurance products are offered through LPL or its licensed affiliates. To the extent you are receiving investment a dvice from a separately registered independent investment advisor that is not an LPL affiliate, please note LPL makes no representation with respect to such entity.
Not Insured by FDIC/NCUA or Any Other Government Agency | Not Bank/Credit Union Guaranteed | Not Bank/Credit Union Deposits or Obligations | May Lose Value |
RES-1658818-0923 | For Public Use | Tracking #485663 (Exp. 10/2024)