As noted previously, short-term interest rates are at levels last seen in the early 2000s. Moreover, due to the elevated fed funds rate and the subsequent carryover into the U.S. Treasury market, the Treasury yield curve is the most inverted since the early 1980s. That is, shorter-term Treasury securities outyield longer maturity securities. This has finally allowed investors to generate a return on cash. But economists like to remind us there is no such thing as a free lunch. In investment parlance, that just means all investments carry risk, even cash. So where is the risk that economists warned us about? The big risk with cash is reinvestment—that the currently elevated rates won’t last and upon maturity, investors will have to reinvest proceeds at lower rates.
The Fed’s goal has been to take the fed funds rate into restrictive territory to make the cost of capital prohibitively expensive to slow aggregate demand, which should allow inflationary pressures to abate. Then what? Well, after winning its fight with inflation, markets expect the Fed to start cutting rates early next year. After keeping rates at these elevated levels, the Fed will then likely take the fed funds rate back to a more neutral level, which economists believe is 2.5%, or even lower. Just as the aggressive rate-hiking cycle took Treasury yields higher, interest-rate cuts will take Treasury (and other bond markets) yields lower. And that is when the reinvestment risks will show up. Since we’re starting to see positive signs of inflationary pressures easing (along with cracks in the regional banking sector), it is likely the Fed is close to the end of its rate hiking campaign, which would be welcome news for core bonds.
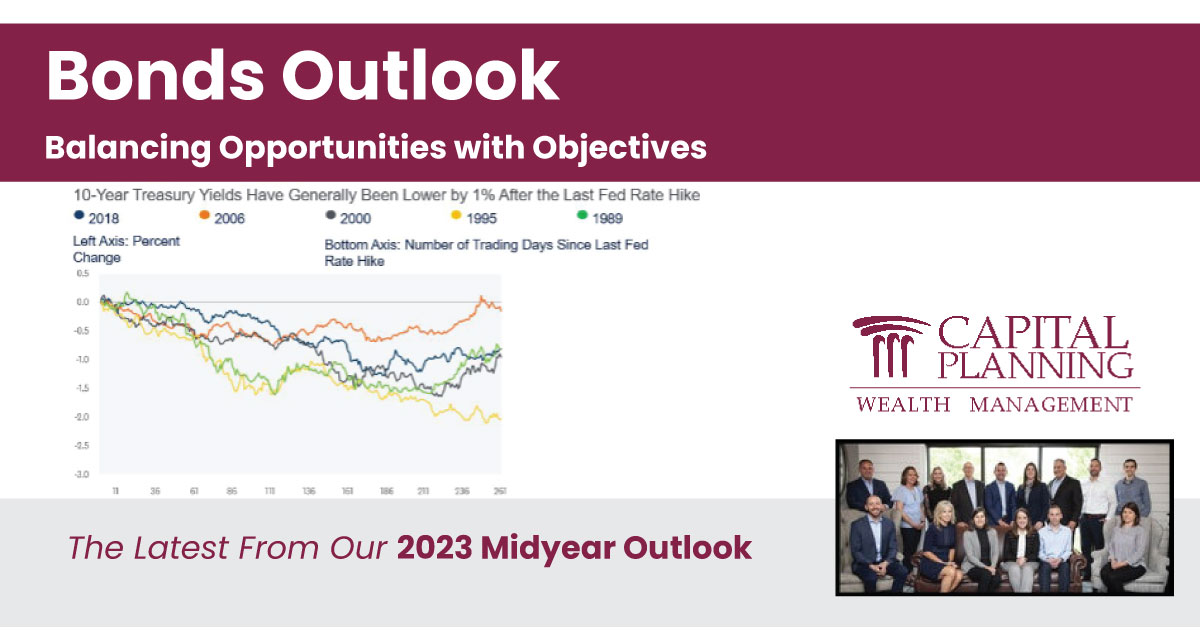
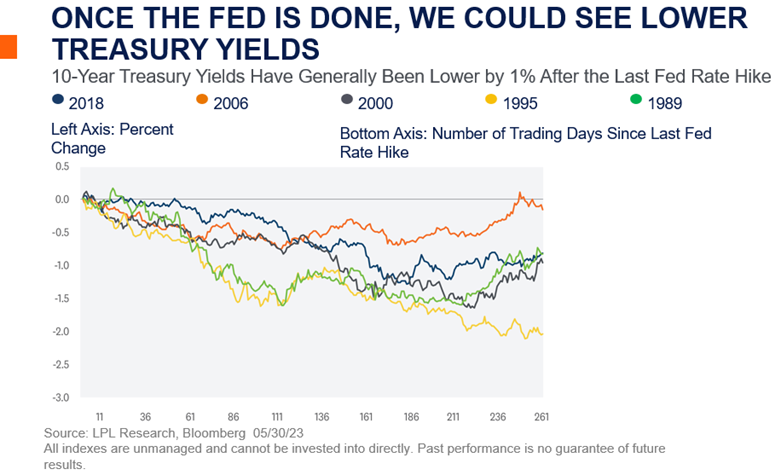
In fact, once the Fed is done raising interest rates, we could start to see lower yields on intermediate-term securities before the Fed actually cuts rates. Of the most recent Fed rate-hiking campaigns [Image Below], 10- year Treasury yields were lower, on average, by 1% after the Fed stopped raising rates. And while our base case remains a trading range for the 10-year yield between 3.25% and 3.75% throughout 2023 (similar to 2006, when the Fed kept rates at elevated levels for over a year), we acknowledge there is a strong bias for yields to end the year lower than our expectations, which could mean strong positive returns for core bonds.
Historically Speaking
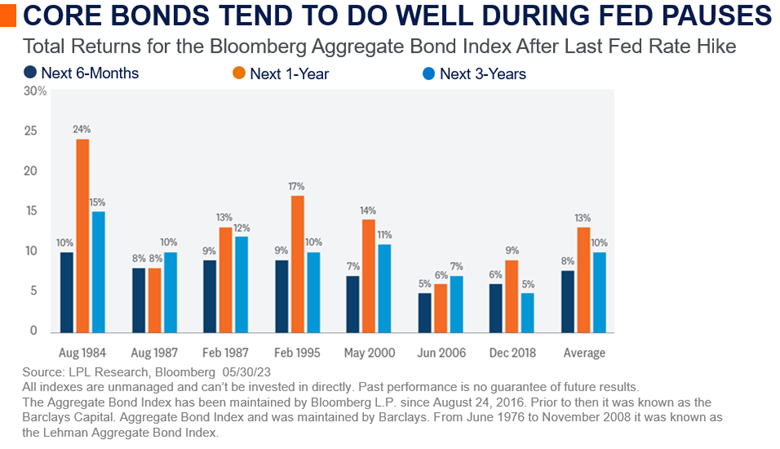
Core bonds, as proxied by the Bloomberg Aggregate Bond Index [Image Below], have performed well during Fed rate-hike pauses. Since 1984, core bonds were able to generate average 6-month and 1-year returns of 8% and 13%, respectively, after the Fed stopped raising rates. Moreover, all periods generated positive returns over the 6-month, 1-year and 3-year horizons.
Now, we also acknowledge there is a risk inflationary pressures remain high and the Fed has to continue its rate-hiking campaign into a weakening economy. As we mentioned in our Outlook 2023, in that stagflationary scenario where the Fed takes the fed funds rate to 6%, we could see the 10-year around 4.75%. However, given where starting yields are, if interest rates increased by another 1% from current levels, fixed income markets broadly could all still generate slightly positive returns over the next 12 months.
While we certainly think cash is a legitimate asset class again, it’s all about balancing today’s opportunity with what may or may not be available tomorrow. So, unless investors have short-term income needs, they may be better served by reducing some of their excess cash holdings and extending the maturity profile of their fixed income portfolio to lock in these higher yields for longer. Bond funds and ETFs that track the Bloomberg Aggregate Index, along with separately managed accounts and laddered portfolios, all represent attractive options that will allow investors to take advantage of these higher rates before they’re gone.
Technical Trends Suggest the Highs Are In For Rates
The technical setup for Treasuries suggests high watermarks for yields have likely been reached. Since core consumer inflation in the U.S. peaked last fall, 10-year yields have registered a string of lower highs that trace together to form a developing downtrend. The recent bearish crossover of the 10-year yield’s 50-day moving average below the 200-day moving average adds to the evidence of a potential downtrend in the making. (For reference, moving averages represent the average yield across a select number of trading days and are used to identify trend direction.) The key word here is “potential,” as yields have not registered consecutive lower lows, a major piece of missing evidence to confirm a new downtrend is officially underway.
Despite several retests, support for the 10-year at 3.25% continues to hold. While yields bottomed at this level in April, it also traces back to the 2018 highs, a major breakout point for yields, as they officially completed a multi-year bottom formation. Given the significance of the 3.25% support level and what we view as limited upside risk for yields based on both technical and macro factors, we suspect 10-year yields will remain bound in the 3.25% to 3.75% range until a confirmed trend develops.
Taking Credit Risk When Appropriate
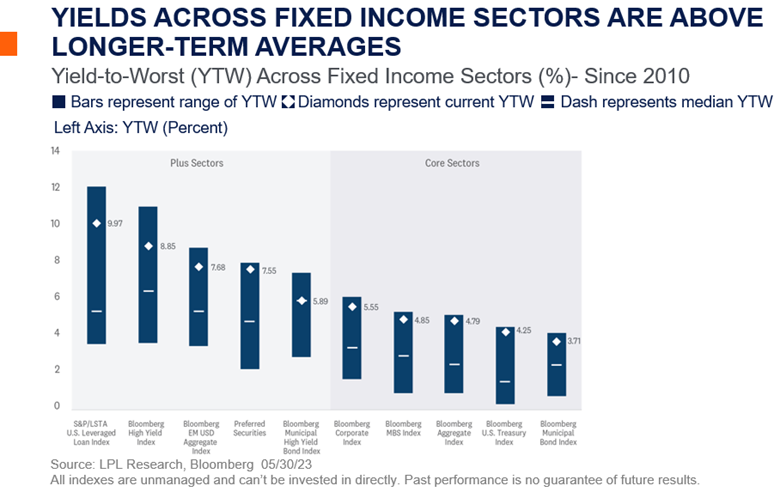
The good news for fixed income investors is now that yields are higher in most fixed income markets, investors can be selective when adding fixed income risk to portfolios. With yields for many core bond sectors still above longer-term averages [Image Below], investors don’t really need to “reach for yield” unless valuations are attractive enough to take on the additional credit risk. While there are others, the most prevalent “plus” sectors are high yield bonds, bank loans, emerging market debt, and preferred securities. We’ve generally been neutral on plus sectors, but with the recent stresses in the regional banking sector, we think a small allocation to preferred securities could be an attractive option for investors that need or want to generate additional income while index yields remain elevated.
Preferreds are concentrated in the financial sector, but since the Global Financial Crisis, many financial institutions have emerged with stronger balance sheets, which should limit downgrades and defaults in our view. As said earlier, we believe the fundamental health of the financial system remains intact, despite the bank stress from domestic regional banks. Here are two reasons why. Depending on the index, regional banks make up less than 10% of the index. Plus the larger money center banks are the largest issuer of preferreds. And while we think the risk of broader bank stresses is still low (and concentrated within regional banks), volatility will likely persist as long as confidence in certain regional banks is questionable.
While we still recommend the majority of fixed income exposure to be allocated to core bonds, for those income-oriented investors willing to take on some additional credit risk, preferred securities may be an attractive investment to consider. Preferreds offer attractive yields, both absolute and after-tax, serving as a total return buffer against future spread volatility. As such, preferred securities can be higher yielding alternatives to traditional core fixed income options, but they do come with additional risk and return volatility.
Important Disclosures:
The opinions, statements and forecasts presented herein are general information only and are not intended to provide specific investment advice or recommendations for any individual. It does not take into account the specific investment objectives, tax and financial condition, or particular needs of any specific person. There is no assurance that the strategies or techniques discussed are suitable for all investors or will be successful. To determine which investment(s) may be appropriate for you, please consult your financial professional prior to investing.
Any forward-looking statements including the economic forecasts herein may not develop as predicted and are subject to change based on future market and other conditions. All performance referenced is historical and is no guarantee of future results.
References to markets, asset classes, and sectors are generally regarding the corresponding market index. Indexes are unmanaged statistical composites and cannot be invested into directly. Index performance is not indicative of the performance of any investment and does not reflect fees, expenses, or sales charges. All performance referenced is historical and is no guarantee of future results.
Securities and advisory services offered through LPL Financial (LPL), a registered investment advisor and broker-dealer (member FINRA/SIPC).
Insurance products are offered through LPL or its licensed affiliates. To the extent you are receiving investment advice from a separately registered independent investment advisor that is not an LPL affiliate, please note LPL makes no representation with respect to such entity.
Tracking #1-05371105 (Exp. 07/24)